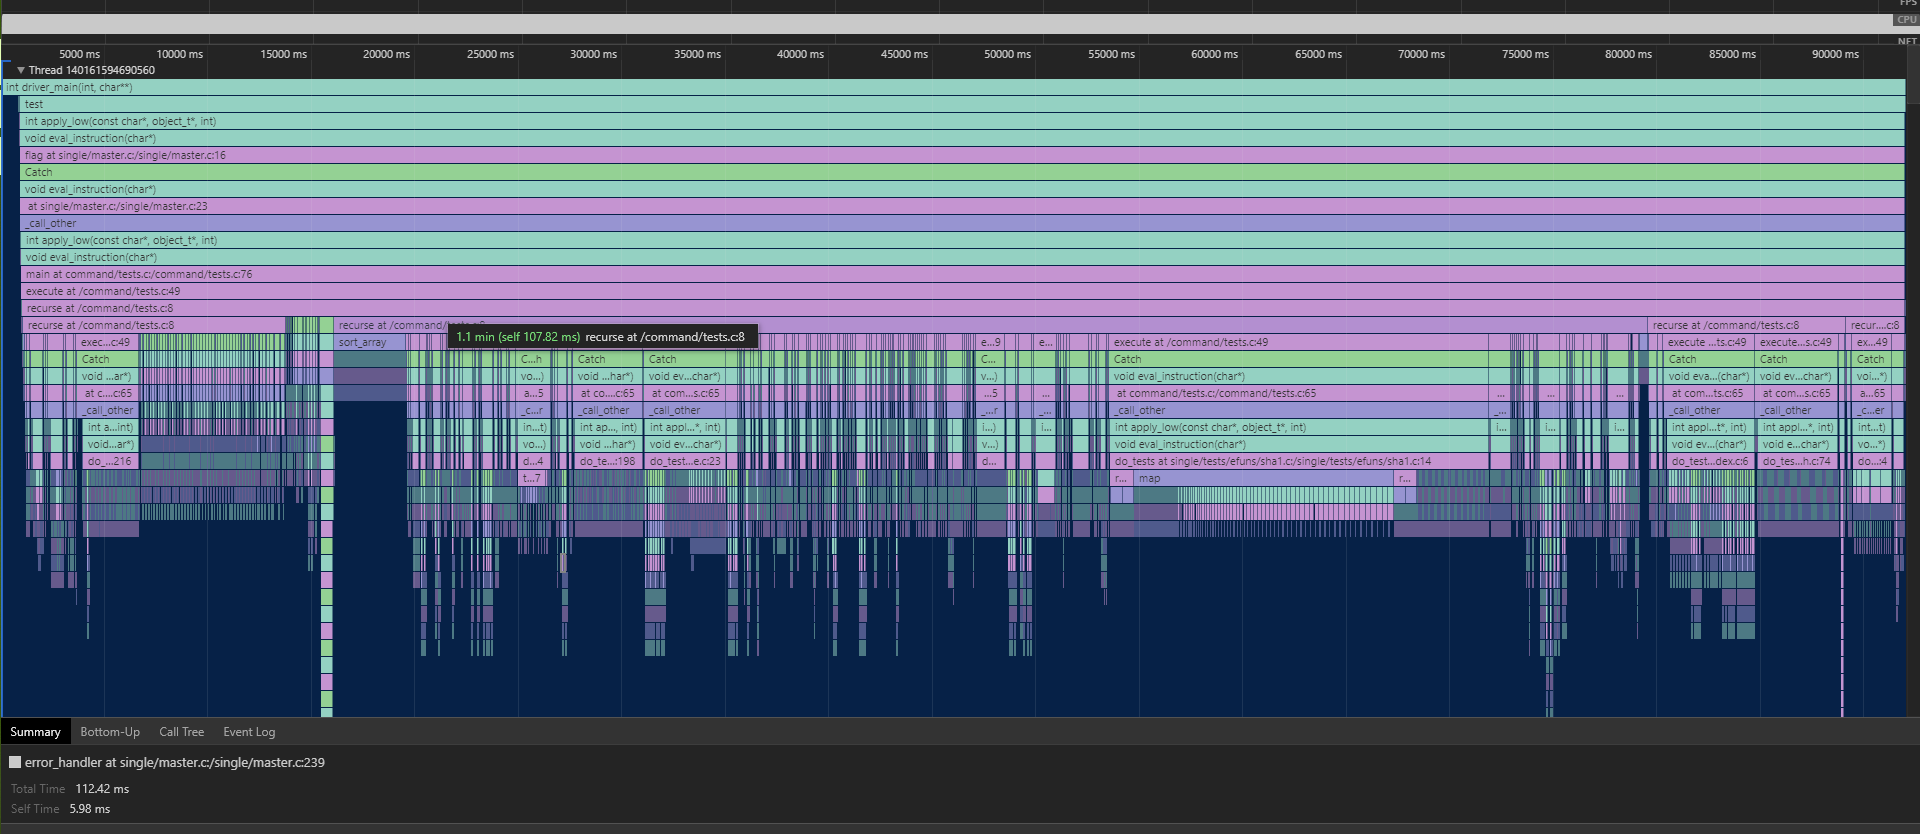
Above is an demonstration of LPC tracing enabled run of test suite. As you can see, this will gives you an easy way to see where did driver spend time in the VM, including EFUNs!
More are coming. Stay tuned
Above is an demonstration of LPC tracing enabled run of test suite. As you can see, this will gives you an easy way to see where did driver spend time in the VM, including EFUNs!
More are coming. Stay tuned
An small tutorial:
trace driver from startup, this is suitable if you want an full trace of single run of the driver . This is the method currently used in testsuite.
Execute ./driver --tracing trace_driver.json <config> and driver will automatically collect all traces and save it on exit.
in LPC , call trace_start("trace.json", 10); , this will have driver to collect trace for the next 10 seconds, If you need to end collection sooner, you can call trace_end() , otherwise driver will automatically stop collecting after timeout.
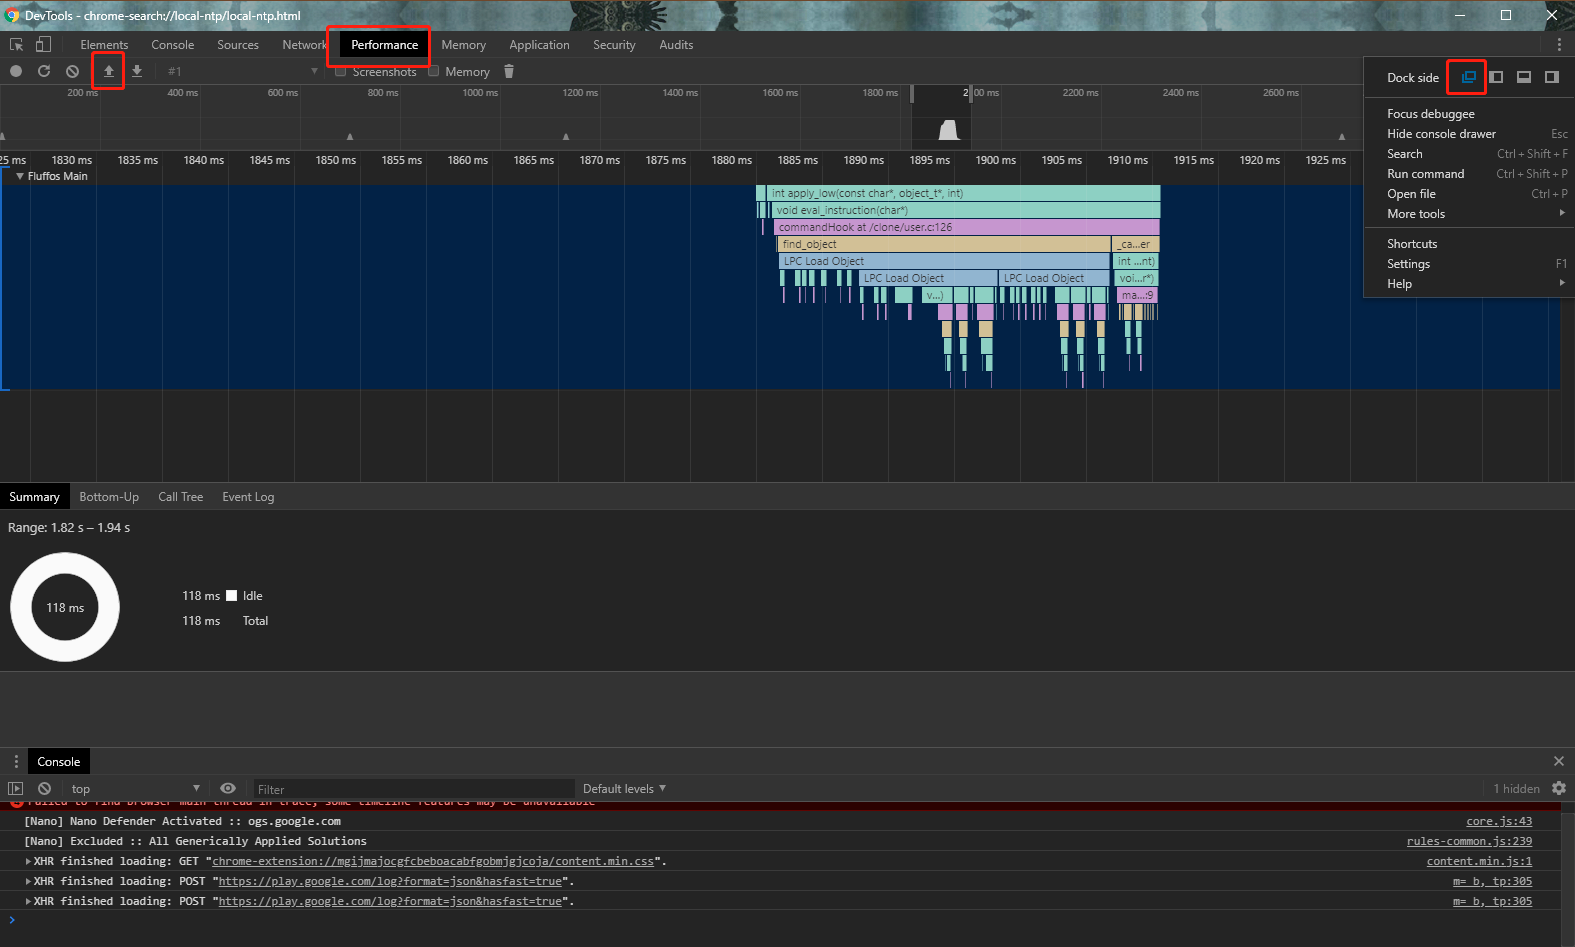
Open chrome Devtools
Open as full window , Switch to “Performance" Tab , and load the trace json.
As you can see, The trace is color coded, The stack usually start at apply_low() , and the longer the span is, meaning the longer it costs to execute that function. You can zoom in and figure out what has been executing on CPU.
Tracing has performance cost, make sure you don’t run tracing for too long, otherwise driver will run out of memory.
For safety reason, tracing efun is restricted to at most 5 minutes and 1 million events .