Memory Leak - Production Mud

Hello!

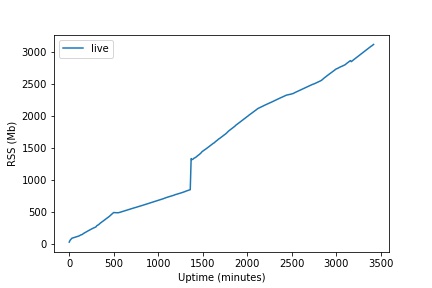
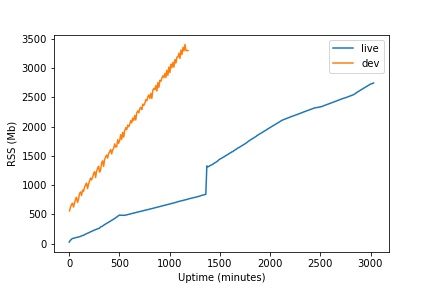
Unfortunately it seems we are still experiencing a linear memory leak. See below a uptime (minutes) vs RSS (Mb) chart for our live and development servers.

mem

Notes:

  1. On dev we ran the equivalent of the testsuite’s ‘stress_memory’ function every 10 seconds.
  2. Neither live nor dev have any compiler options on.
  3. The spike on live was us worrying maybe we had not properly switched the 2019 branch, and verifying that reclaim_objects() was also freeing memory by doing the equivalent of ‘stress_memory’. Yay, it did.
  4. I was saving RSS data using a 10 minute cron job, which is why dev is ‘noisy’.

I wanted to investigate so we loaded up the testsuite using: debug, debugmalloc, debugmalloc_extensions and package_develop and I ran it for awhile doing stress_memory every 10 seconds. I changed it to i<1000 instead of i<100. This is that running for a few hours:
lil

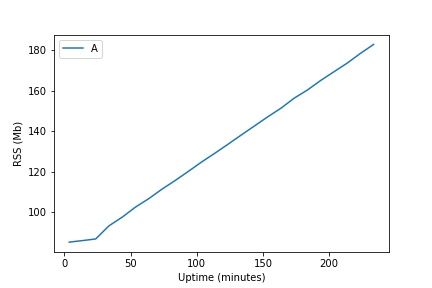
Note that there is a fairly long period until the memory leak overcomes the initial jump in RSS caused by populate_mixed(1). I believe this initial reservation ‘jump’ is why running stress_memory makes it look like Max RSS is stable after a fresh testsuite boot. At i<100 it would take roughly 5 hours to catch up.

To test this I rebooted and replaced:
HOLDER->populate_mixed(1);
with
load_object( HOLDER );
so that stress_memory now looks like:

#define HOLDER "/clone/memory_holder"

void report() {
    write("After: \n" + mud_status(0) + "\n");
}

int main(string arg) {
    write("Before: \n" + mud_status(0) + "\n");

    write("populate Map... \n\n");

    for(int i=0; i<1000; i++) {
        //HOLDER->populate_map(1);
        load_object( HOLDER );
        if(find_object(HOLDER)) {
            destruct(find_object(HOLDER));
        }
    }
    call_out("report", 1);
    reclaim_objects();

    return 1;
}

If we start a fresh boot of the testsuite we can make the reserved memory increase arbitrarily fast using this method. It is also easy to do via eval if you want to change N:

eval return explode( mud_status(0) , "\n" )[<2..<1]
eval for( int i = 0 ; i < N ; i++ ) destruct( load_object( "/clone/memory_holder" ) );reclaim_objects();

The amount gained is fairly consistently within the range of [500,1000]*N bytes for us.

I would also highlight that at no time during this does check_memory return any leaks or mismatched reference numbers.

On a side note it seems that it is possible to maybe roll the memory_info() integer? On a fresh boot of the testsuite:

> eval for( int i = 0 ; i < 7000 ; i++ ) {object ob = load_object( "/clone/memory_holder" );ob->populate_map(1);destruct(ob);}

Result = 0
> eval return explode( mud_status(0) , "\n" )[<2..<1]

Result = ({ /* sizeof() == 2 */
  "Total accounted: 18446744071646916586",
  "Max RSS: 4380733440"
})
> eval return memory_info()
Result = -2062635551

FYI: I have not tried rolling without debug, debugmalloc, debugmalloc_extensions and package_develop compile options on.

Thanks for reporting back: can you give me a look at your new mud_status(1) for both live & dev mud? if you can build a chart with all the values in there, it would be great tool to see what exactly is taking more memory?

Also, note that mud_status(1) actually uses rsuage() , which only reports “Max RSS” , not real rss, so it is understandable that value will only ever go up. do you have data from system monitoring ?

Thanks for the quick response! All the info in the charts is collected from the system via ‘ps’. I understand that mud_status() Max RSS is not a good measure, and when I said “we can make the reserved memory increase arbitrarily fast using this method” I did mean via system monitoring.

  1. Dev isn’t up because we’ve been running lil and the testsuite.
  2. Below is mud_status(1) from live. It is the same instance as shown in the chart above. I also included an updated chart. I am not sure if logging information from mud_status(1) would be useful, since memory on the VM side is cleaning up as expected? I’m happy to write some sscanf stuff for it if you think it would be helpful.

Returns: "current working directory: XXXX/lib

add_message statistics
------------------------------
Calls to add_message:  4865934   Packets:  4865934   Average packet size: 76.72 bytes


Hash table of living objects:
-----------------------------
569 living named objects, average search length: 1.49


Apply lookup cache information
-------------------------------
% cache hits:         24.12
total lookup:     4136230250
cache hits:       997709462
cache size (bytes w/o overhead):    15048216

Object name hash table status:
------------------------------
Elements:        7283
Memory(bytes):     58264
Bucket count:    10273
Load factor:     0.708946

Heart beat information:
-----------------------
Number of objects with heart beat: 1022.

Call out information:
---------------------
Number of allocated call outs:        9,      576 bytes.
Current handle map bucket: 127
Current handle map load_factor: 0.070866
Current object map bucket: 20753
Current object map load_factor: 0.000434
Number of garbage entry in object map: 0

Memory statistics
------------------------------
Sentences               22437   897480
Objects                  8602  8077024
Interactives               12    28128
Prog blocks              2957  4559688
Arrays                 101680  9035344
Classes                  9139   836424
Mappings                30602  6762312
Mappings(nodes)         76497  3059880

Heart beat information:
-----------------------
Number of objects with heart beat: 1022.

All strings:
-------------------------        Strings    Bytes
All strings            152828  3732873 + 3733408 overhead
Total asked for                   548026  9769043
Space actually required/total string bytes 76.427967%
Searches: 5057695816    Average search length:  1.446
Table size: 8192, Load factor: 18.655762
String pool is overloaded, please consider increase in the config 'hash table size'!


Summary
------------------------------
Total accounted: 55897213
Max RSS: 3271790592

Here is the system level RSS taken a few seconds later:

    PID ELAPSED    VSZ   RSS COMMAND
   XXX 205866 4180140 3196540 XXX/bin/driver XXX/bin/config

Here is an updated chart of system level RSS vs ELAPSED time
mem

ok, so I think it is time we whip out some heavy machinery. Here is how to use jemalloc to do memory profiling

First start your mud in this way

export MALLOC_CONF=confirm_conf:true,prof:true,lg_prof_interval:30,lg_prof_sample:24,prof_final:true
./driver config

and

  1. you will see jemalloc print out the configs on startup, so you know things are in effect.
  2. you will get a series of jemalloc memory profiling dumps in the directory, once you have that , use this command to generate some dot graph and send it to me
jeprof --pdf driver <...prof>

with above settings , you should be able to get a picture of memory allocation activity every 1GB and every 16MB newly allocated. so you should be able see the series of dump and compare what exactly was being added.

Also, try running entire driver under jemalloc, this will make sure the library used by driver will use jemalloc managed memory, not just the VMs

LD_PRELOAD=`jemalloc-config --libdir`/libjemalloc.so.`jemalloc-config --revision` driver config

I DM’d you the dropbox info with everything you requested above!

I also spent awhile looking at heaps over time (i50 compared to i60, etc etc) and if I pretend that I know what I"m looking at, which I assuredly do not, it seems that memory is increasing entirely within the “std Hashtable” chain.

Yeah, that is very interesting, it also speaks to the mud_status() result that your apply look up table hit rate is so ridiculously low.

are you doing something creative like quickly destructing object immediately after creating? Can you get a list of objects using

eval return objects()

And let me see if there are any pattern about how objects are created and destructed?

We have two features which were designed to limit total loaded objects, yes. Mostly for legacy reasons.

  1. “Generic objects” which allow common items (spell components, potions) which players tend to have lots of to be treated as a single object with an attribute array. As generic objects are interacted with they are split into appropriately sized stacks which are then recombined either at the end of the call stack or instantly, as appropriate. This involves some fast creates and destructs. This generally keeps our object count about 8000 lower and improves player load times significantly.
  2. If a player leaves a room with no add_actions, spawns, etc and that room has nothing in it then the room will try to dest at the next heartbeat. This lowers our object count by a few hundred per active player.

All other objects are loaded and dested normally with clean_up and reset or though player actions.

Yeah, in that case you are really just trading cpu for memory, and that’s usually not a good trade off. It is a interesting use case , which we can try to optimize later.

That could explains the why there are a lot of Malloy activity around apply cache. But that part shouldn’t really leak, as long as the total number of objects doesn’t grow indefinitely.

Yesterday I went over the mapping code and discovered it never release memory for mapping nodes ( items in a mapping) , just recycle it. So if the max total mapping nodes are always increasing you will see an liner increase as well, but it should be taking on much. I am doing some more poking around how to do a better memory profiling, will report back soon.

I pushed https://github.com/fluffos/fluffos/pull/755 and I observed enabling background_thread for jemalloc make it reclaim memory much faster.

I can also consider adding a reclaiming support for mapping nodes, but let’s get some new data using the accounting improvement first: in short, if the mud’s total mapping nodes forever increases, it will never be freed

> stress_memory
Before: 
Apply cache               479    11496
oname htable              254     2032 (buckets 257)
call out                    4      256 (buckets 29)
Sentences                   8      320
Objects                   269    61200
Interactives                1     2344
Prog blocks               229   195912
Arrays                     11     1128
Classes                     0        0
Mappings                    3    10768 (nodes 25, size 1000, free 231, size 9240)
All strings              1811    50607 + 109000 overhead
Total accounted:   445255
Max RSS: 15454208

populate Map... 

> 
After: 
Apply cache               465    11160
oname htable              254     2032 (buckets 257)
call out                    3      192 (buckets 29)
Sentences                   8      320
Objects                   254    58064
Interactives                1     2344
Prog blocks               222   190600
Arrays                      9     1048
Classes                     0        0
Mappings                    3  6677008 (nodes 25, size 1000, free 166887, size 6675480)
All strings              1778    49644 + 108208 overhead
Total accounted:  7100780
Max RSS: 70455296

jemalloc dump done...

This is a bit of a side note.

The lib is fairly old. Back in the day, it used to run 80-100 players, so memory usage was an extreme focus under MudOS. RAM availability comparatively in 1993 was significantly different than it is now. 8 gig+ of ram was not the norm back then.

On that note if a player passed through a room - moving quickly, those rooms discard fairly fast and we force clean up. There’s a very high level of ‘player moves from one area to the next’ with those rooms loading quickly, and then being discarded.

I’ll probably make a post in the ‘wish list’ thread related to this and clean_up() and reset() at some point. We’re not using reset() and clean_up() in the traditional sense.

Our method of destructing many objects is probably a huge outlier and brought the issue to a head whereas other prod muds aren’t doing that insanity. :wink:

But hey, it was worth it, right? We found some ugly memory issues? Right? :smiley:

So yeah… I found this hysterical.

[Cre] Tarik : most muds probably don’t have 15 npc ships and 200 fucking dolphins running around a 900,000 room ocean

We’re kind of a strange mud.

Ever since save_binary stop working the load_object() is a bit costly( all the parsing, optimizing doing again and again) . It is on my list to optimize next. So you should safely assume someday it will just be magically faster without changing anything.

Did the apply cache fix catch the leak? I would think it should.

Tarik ran the test scenarios on our dev site however when we pushed it to live and driver crashed twice right away once players started moving around.

******** FATAL ERROR: BUG: jumped out of event loop!
FluffOS driver attempting to exit gracefully.
(current object was /secure/simul_efun)
Recent instruction trace:
--- trace ---
--- frame 4 ----
Object: /secure/simul_efun, Program: /secure/simul_efun.c
   in old_find_match() at /secure/simul_efun/find_match.c:67
arguments: ["gems", ({ /* sizeof() == 2 */
  /d/pangea/stygia/hylar/crossroads/armour/plumevisor#28,
  /d/pangea/stygia/hylar/crossroads/armour/fullplater#27
})]
locals: [0, 0, 0, 0, 0, 0, 0, 0, 0, 0, 0, 0]
--- frame 3 ----
Object: /secure/simul_efun, Program: /secure/simul_efun.c
   in find_match() at /secure/simul_efun/find_match.c:10
arguments: ["gems", /d/pangea/stygia/hylar/crossroads/npcs/cent#25]
locals: [0, 0, 0]
--- frame 2 ----
Object: /global/player#20, Program: /global/events.c
   in event_death() at /global/events.c:1545
arguments: [/d/pangea/stygia/hylar/crossroads/npcs/cent#25, ({ /* sizeof() == 1 */
  /global/player#20 ("ellywick")
}), /global/player#20 ("ellywick")]
locals: [/global/player#20 ("ellywick"), ({ /* sizeof() == 2 */
  "npc",
  "coins,gems,keys"
}), ({ /* sizeof() == 1 */
  /obj/money#26
}), ({ /* sizeof() == 1 */
  /obj/money#26
}), "gems"]
--- frame 1 ----
Object: /secure/simul_efun, Program: /secure/simul_efun.c
   in event() at /secure/simul_efun/event.c:34
arguments: [/d/pangea/stygia/hylar/crossroads/moat19, "death", ({ /* sizeof() == 2 */
  ({ /* sizeof() == 1 */
    /global/player#20 ("ellywick")
  }),
  /global/player#20 ("ellywick")
})]
locals: [/d/pangea/stygia/hylar/crossroads/npcs/cent#25, ({ /* sizeof() == 3 */
  /d/pangea/stygia/hylar/crossroads/moat19,
  /global/player#20 ("ellywick"),
  /d/pangea/stygia/hylar/crossroads/npcs/cent#29
})]
--- frame 0 ----
Object: /d/pangea/stygia/hylar/crossroads/npcs/cent#25, Program: /std/living/combat.c
   in do_death() at /std/living/combat.c:330
arguments: [/global/player#20 ("ellywick")]
locals: [19015, 100, 35000, 0, 26950, /global/player#20 ("ellywick"), 0, "/std/races/dwarf"]
--- end trace ---
crash() in master called successfully.  Aborting.
Aborted (core dumped)

We’re investigating and will report back.

I haven’t had a chance to look into it, but just some context: I compiled the v2019 branch which led to this crash. We haven’t tried the master branch.

The memory leak was completely fixed when executing the test scenario on both dev and within the testsuite.

Thanks, and keep me posted!

Okay, I tracked down the crash. It is easily reproducible using lil and the testsuite.

The following code does not error, but will crash the mud via ******** FATAL ERROR: BUG: jumped out of event loop! so long as str is 4 characters.

In the above example it broke on “gems”, i broke it in early testing trying to ‘cd item’. Then I tested it with about 50 random strings of length 4 from [a-zA-z0-9!@#$%^&*()_±= ]

explode( str , " and " );

EDIT: I should say it doesn’t matter if you change any of the explode options in config. I tried all three variations there.

Sorry for the delay, the fix has been merged onto master.

Thank you very much. You have been beyond helpful.

Everything appears to working well - we are stressing the crap out of our development site.

3 days of production uptime, sitting solidly at 120-124 meg of usage. Thank you again so much!